Select Monitors → Event Log to view entries that are currently stored in the management-module event log.
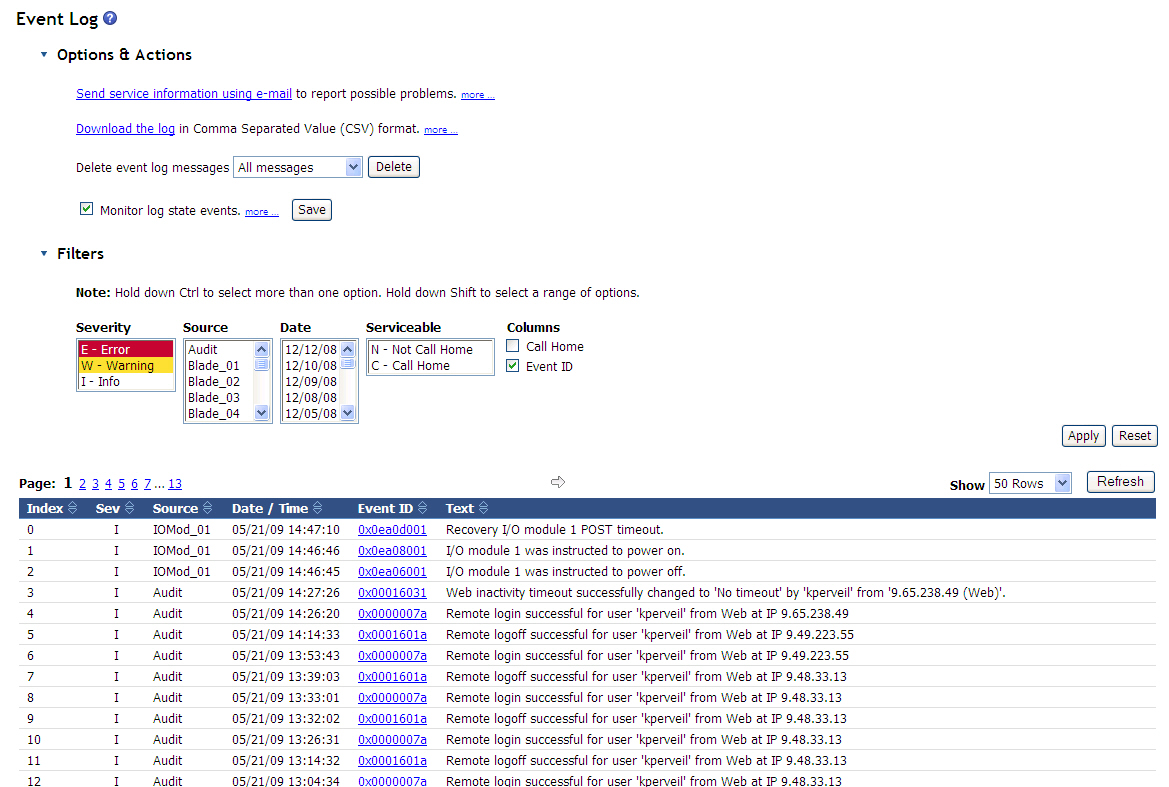
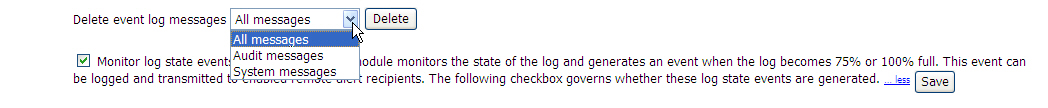
The event log page includes entries for system events, which are detected by the BladeCenter unit and installed components, and for audit events, which are generated by users. The event log page displays the most recent entries first. Information about all remote access attempts and changes to the advanced management module configuration settings are recorded in the audit log, and the management module sends out the applicable alerts if it is configured to do so. The event log is of fixed capacity. When the log is full, new entries overwrite the oldest entries. On the BladeCenter T or BladeCenter HT unit, when the log is full, the BladeCenter® T or BladeCenter HT MNR (minor alarm) LED is lit. If you do not want the management module to monitor the state of the event log, clear the Monitor log state events check box at the top of the event log page.
You can sort and filter entries in the event log page and suppress the display of event IDs that link to event information; clicking on an event ID link displays detailed event information and recommended actions, when appropriate. See the event log help for more information. See the BladeCenter Advanced Management Module Messages Guide for a complete list of all non-device specific events and recommended actions, sorted by event ID. Device specific event information is in the documentation for the device.
- BladeCenter unit (SERVPROC)
- Blade device by bay number (Blade_xx)
- Operator actions (Audit)
- Storage module by bay number (Stor_xx)
- I/O module by bay number (IOMod_xx)
- Cooling device by number (Cool_xx)
- Power module by number (Power_xx)
- xx in an event source refers to the bay number of the reporting device.
- Events that trigger alarms on the Blade Center T unit send alerts to the advanced management module. Alerts are assigned severity ratings of Error, Warning, and Information. Critical and major events are written to the log as errors, and minor events are written as warnings.
Select the Call Home checkbox to see which events are serviceable. Serviceable events are usually triggered by hardware or firmware issues. If you have activated the Service Manager feature (see Configuring Service Advisor), these events will be automatically reported.
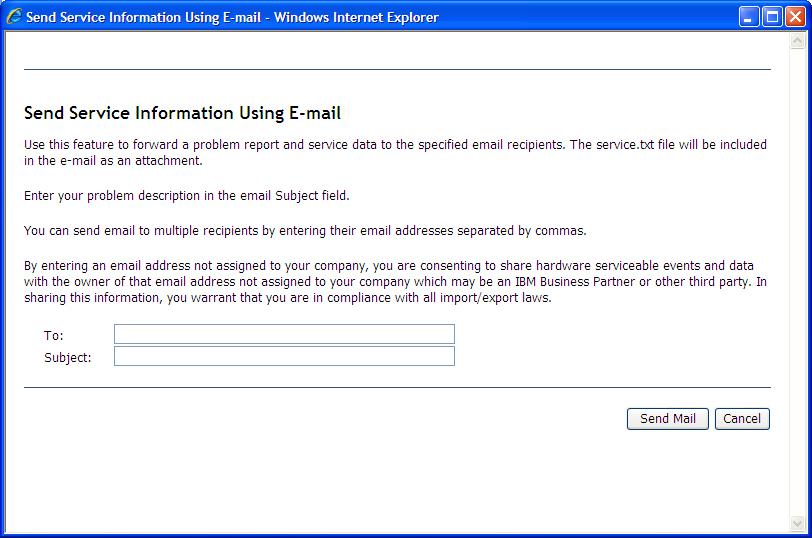
You also can click the Send service information using e-mail link to send a snapshot of the event log to a specified email address. This choice will display a popup window, similar to the illustration below, that you can use to specify the email address and purpose of the communication. The SMTP server must be configured to use this feature (see Network Protocols for information). Click the Download the log link to download and save a copy of the event log in comma-separated value (CSV) format.